What Is a Good Orthopedic Implant Production Capacity?

Time:2026-10-16 Author:Oliver
0%

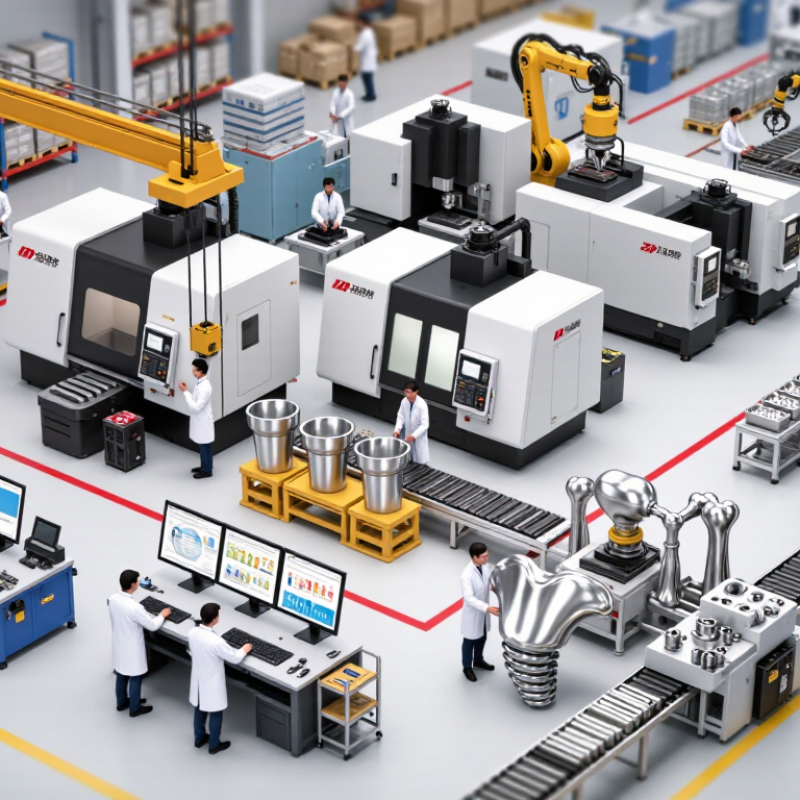
A good orthopedic implant production capacity is more than a large annual output figure. It reflects whether a manufacturer can repeatedly produce safe, traceable, and clinically reliable devices. This is the practical focus of “How to evaluate the production capacity of orthopedic implants manufacturers.” Buyers should examine validated machining, forging, additive manufacturing, surface treatment, cleaning, packaging, and sterilization processes. Each stage affects delivery reliability.

W. Edwards Deming, a respected manufacturing quality expert, said, “You cannot manage what you cannot measure.” His statement remains highly relevant to orthopedic implant production. A serious evaluation should review monthly output, equipment utilization, production yield, scrap rates, changeover time, and batch-release performance. It should also examine inspection capacity, skilled labor coverage, maintenance records, and supplier continuity. A factory producing 100,000 implants annually may still struggle if one coating line stops for two weeks. Small details matter.

Capacity has a human side. Experienced engineers must understand titanium, cobalt-chrome, stainless steel, and polymer components. Quality teams need reliable measurement systems, documented nonconformity handling, and complete lot traceability. Regulatory compliance alone does not prove strong capacity. Nor does an impressive factory tour. That is where evaluation becomes imperfect. Public figures may hide overtime, subcontracting, low yields, or delayed inspections.

The best assessment combines documents, production records, site observations, and uncomfortable questions. Can the manufacturer support demand increases without weakening quality? Can it recover after equipment failure? Can it maintain consistent output during urgent orders? These answers reveal real capacity—not merely advertised capacity.
What Is a Good Orthopedic Implant Production Capacity?

Defining Good Capacity: Annual Units, Product Mix, and Demand Coverage

A good orthopedic implant production capacity is not simply the number of units a factory can make. It is the number of compliant, traceable, and deliverable units produced consistently each year.

Annual capacity should be measured by product family, not one impressive total. A facility may produce 80,000 implants annually, but that figure can mislead. Hip stems, trauma plates, and spinal components require different machines, tooling, inspections, and packaging steps. A practical capacity plan separates standard products from complex designs. It also accounts for maintenance, training, validation, and rejected parts. Capacity on paper is not capacity in practice.

Product mix must reflect real demand. A line producing several sizes may need frequent changeovers, which reduce available hours. Engineers should review monthly orders, seasonal variation, safety stock, and forecast accuracy. Demand coverage can then be expressed in months, such as maintaining three months of finished inventory for stable products. Critical components may need stronger coverage, but excess stock can age, tie up cash, or become obsolete after design changes.

Measure it carefully. Use historical output, first-pass yield, inspection time, and equipment utilization. I have seen plans assume near-perfect efficiency. That assumption deserves challenge. A better model includes realistic downtime and a reserve for urgent orders. Quality release remains the controlling point, because shipped units must meet specifications, records, and applicable regulatory requirements before they count as usable capacity.

Benchmarking Factory Performance with a 70–85% OEE Target

What Is a Good Orthopedic Implant Production Capacity?

For orthopedic implant factories, a 70–85% Overall Equipment Effectiveness (OEE) target is a practical performance benchmark. OEE combines availability, performance, and quality. It shows how much planned production time creates acceptable parts. A higher number is not always better. Pushing equipment too hard can increase tool wear, inspection delays, and rejected implants.

A line running at 78% OEE may outperform a faster line with unstable quality. For example, a machining cell scheduled for 480 minutes may lose 45 minutes during setup and maintenance. It may then produce 390 acceptable components instead of its theoretical maximum. Recording these losses by shift reveals whether capacity problems come from operators, equipment, materials, or process design. Small details matter. A delayed fixture can affect the whole schedule.

Reliable capacity planning also includes sterilization, inspection, documentation, and staff availability. These steps can become hidden bottlenecks. Factories should compare OEE by product family, not only by department. Complex implants often require slower cutting speeds and more inspection time. That is reasonable when dimensional accuracy and traceability are critical. However, an OEE target alone cannot prove production readiness. Measurement methods may be inconsistent, and some downtime categories may be misclassified. Review the data regularly. Improve the process, not just the number.

Calculating Throughput Across CNC, Cleaning, and Sterilization Steps

What Is a Good Orthopedic Implant Production Capacity?

Calculating Throughput Across CNC, Cleaning, and Sterilization Steps

A good production capacity is not the CNC machine’s advertised output. It is the number of conforming implants released on schedule. In practice, throughput is limited by the slowest connected process. A CNC cell may complete 120 components daily, while cleaning handles only 80 per basket cycle. Sterilization may process 160 components, but each load could require four hours, including cooling and monitoring.

Measure each step using actual production records. Record machining time, tool changes, inspection holds, cleaning loads, sterilization cycles, and rejected parts. Then calculate effective capacity, not theoretical capacity. For example, 100 machined parts with 8% scrap produce 92 acceptable parts. If cleaning loses another 3%, only about 89 parts reach sterilization. Small losses accumulate quickly.

Bottlenecks move.

A strong assessment also includes setup time, maintenance, staffing, and validated cycle limits. Cleaning capacity depends on basket arrangement and surface complexity. Sterilization capacity depends on load density, cycle duration, and required release checks. I have seen plans fail because they counted machine hours but ignored queue time between departments. That mistake is easy to repeat. Leave practical buffer capacity for rework, preventive maintenance, and unexpected inspection delays. A reliable target may use 70–85% of calculated maximum capacity, then improve it with measured evidence rather than optimistic assumptions.

Meeting ISO 13485:2016 and FDA 21 CFR Part 820 Requirements

What Is a Good Orthopedic Implant Production Capacity?

Meeting ISO 13485:2016 and FDA 21 CFR Part 820 Requirements

A good orthopedic implant production capacity is more than a monthly unit target. It is the number of devices a facility can make consistently while protecting safety, traceability, and product quality. Every stage matters, from titanium receipt to final packaging. Capacity planning should include trained operators, validated equipment, clean production areas, inspection time, and reliable suppliers.

ISO 13485:2016 requires a controlled quality management system for medical devices. FDA 21 CFR Part 820 also expects documented procedures, design controls, process validation, corrective actions, and production records. Each implant should have clear identification and complete manufacturing history. Inspection results must connect to approved specifications. Small gaps can create large delays.

Production teams should measure actual output, not theoretical machine speed. A useful review tracks cycle time, equipment downtime, rejected parts, rework, staffing levels, and release time. It also tests whether quality staff can review records without rushing. That detail is often underestimated. A capacity estimate can be wrong when maintenance, supplier delays, or investigations are ignored. I have found that a slower, controlled process is usually more dependable than an ambitious target with weak documentation. Even mature facilities should challenge their assumptions and revise capacity after process changes.

Planning 15–20% Reserve Capacity for Demand Peaks and Scrap

What Is a Good Orthopedic Implant Production Capacity?

A good orthopedic implant capacity is more than a machine’s monthly output. It must include qualified staff, validated processes, inspection time, maintenance, and material availability. For demand peaks, plan 15–20% reserve capacity above the expected production volume. This buffer protects delivery schedules when urgent orders, equipment downtime, or labor shortages occur. It also absorbs normal scrap from machining, finishing, cleaning, and final inspection.

For example, a facility expecting 10,000 acceptable implants monthly should plan capacity for approximately 11,500 to 12,000 units. The calculation must reflect actual yield, not theoretical machine speed. If the historical scrap rate reaches 6%, the reserve may need adjustment. Bottlenecks often appear in surface finishing or inspection, not machining. A spreadsheet can look precise while missing these practical limits. Our first capacity plan also underestimated tool changes. That mistake reduced available production hours more than expected.

Tips: Review capacity every month using real yield, downtime, overtime, and inspection data. Separate planned reserve from emergency overtime. Keep critical equipment service windows inside the schedule. Test the plan against a sudden 20% demand increase. Also question whether every reserve hour is truly usable. Trained operators, calibrated instruments, and documented process controls determine that answer. A small pilot run can expose hidden constraints before a peak arrives.

FAQS

What is a practical OEE target for an orthopedic implant factory?

A 70–85% OEE range is a practical benchmark. It combines availability, performance, and quality. Higher is not automatically better.

Why can a 78% OEE line outperform a faster line?

Stable quality may matter more than speed. A faster line can create more tool wear, inspection delays, and rejected parts. Consistency wins.

How should a factory investigate lost production time?

Record setup, maintenance, waiting, and stoppage losses by shift. A 480-minute shift might lose 45 minutes. A delayed fixture can affect the entire schedule.

What areas can become hidden capacity bottlenecks?

Sterilization, inspection, documentation, and staffing can limit output. Machining may finish early while inspection queues remain full. The bottleneck can move.

How much reserve capacity should factories plan for demand peaks?

Plan roughly 15–20% above expected acceptable production. For 10,000 monthly units, this means about 11,500–12,000 planned units.

Should reserve capacity be based on machine speed?

No. Use actual yield, downtime, staffing, maintenance, and inspection data. Theoretical speed can look impressive but mislead planning.

How does scrap affect capacity planning?

Scrap reduces usable output. A 6% historical scrap rate may require additional capacity beyond the normal reserve. Include machining and final inspection losses.

How often should production capacity be reviewed?

Review it monthly using real yield, downtime, overtime, and inspection records. Test the plan against a sudden 20% demand increase. One review may miss seasonal pressure.

What should factories do when their capacity plan proves inaccurate?

Recheck tool changes, operator availability, instrument calibration, and process controls. A previous plan may underestimate tool-change time. That mistake deserves review.

Can an OEE target prove production readiness?

No. Measurement methods may differ, and downtime categories may be misclassified. A pilot run can expose hidden constraints before demand rises. The number is only evidence.

Conclusion

A good orthopedic implant production capacity is more than a high annual unit count. It should reflect the manufacturer’s product mix, equipment capabilities, workforce, and ability to meet realistic customer demand. How to evaluate the production capacity of orthopedic implants manufacturers requires reviewing the complete process flow, including CNC machining, surface treatment, cleaning, inspection, packaging, and sterilization. Throughput should be calculated by identifying the capacity and potential bottlenecks at each stage, rather than relying only on the output of one department.

Factory performance can also be assessed through Overall Equipment Effectiveness (OEE), with a practical target of approximately 70–85% for a stable operation. Manufacturers should demonstrate compliance with ISO 13485:2016 and FDA 21 CFR Part 820 through documented quality systems, traceability, process controls, and corrective actions. Finally, planning 15–20% reserve capacity helps absorb demand peaks, maintenance downtime, rework, and normal scrap while maintaining reliable delivery performance.

Oliver

Oliver

Oliver is a seasoned marketing professional with a wealth of expertise in driving brand awareness and engagement. With a deep understanding of our company's product offerings, he consistently delivers high-quality content that enriches our professional blog. His insights not only shed light on......